Reports
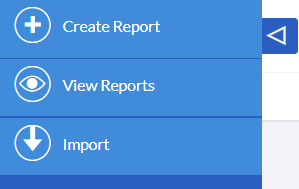
To access the Reports module in BostelCRM, users can click on the 'Reports' link in the navigation menu or access it through the Sales button menu at the bottom of the screen. This module enables users to generate reports on CRM data from any module and provides various features for quick display of important information.
Creating Reports
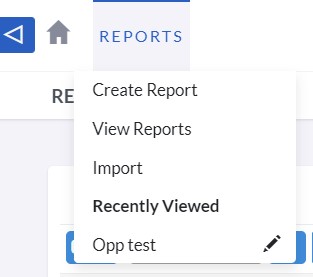
To create a report once in the Reports module on the navigation bar find
and select 'Create Report' or use the 'Add' button at the bottom.
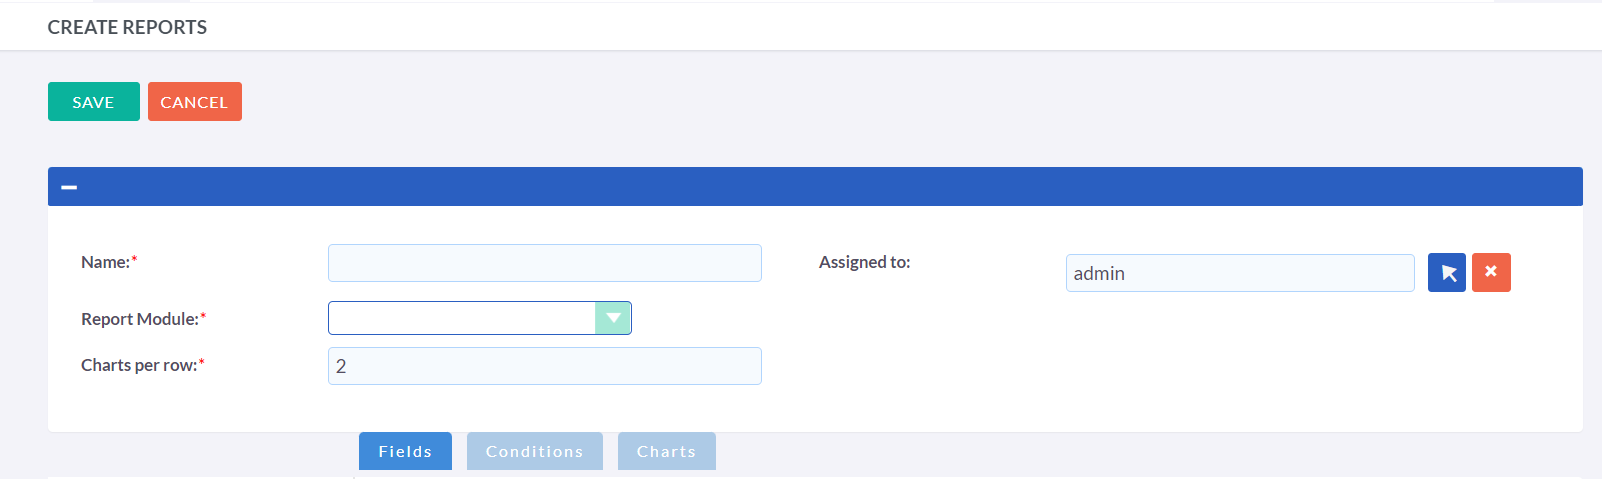
You will be presented with the report Create View. To obtain a list of
fields to add to the report, you have to select a module from the Report
Module drop-down.
Adding Fields
Once you have selected a Report Module, the list of fields available will display on the left panel. You can add fields to the 'Fields' section of the report by expanding the module you wish to select fields from and then drag and drop those fields into the field section.
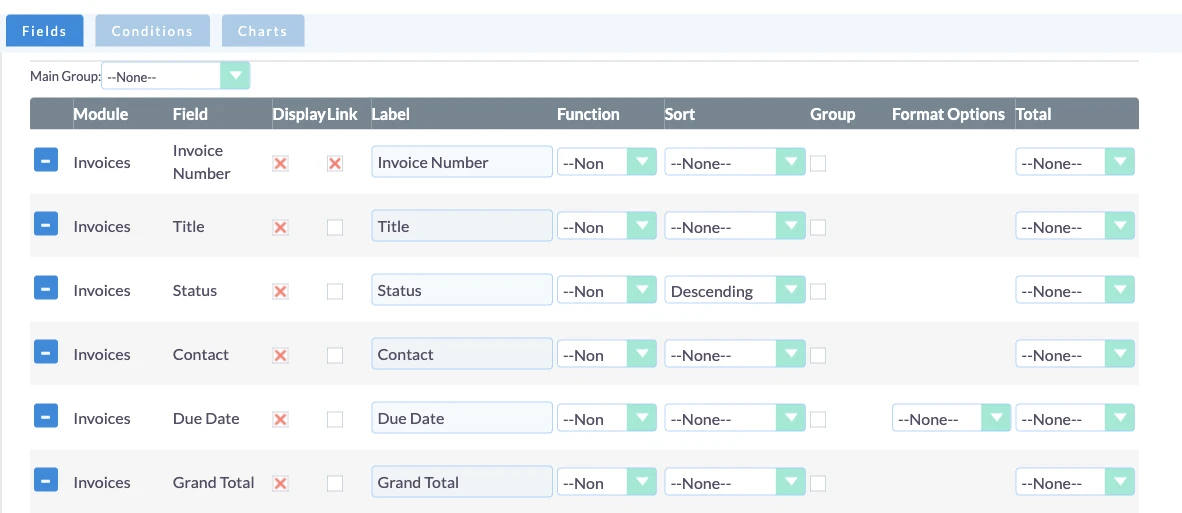
Once you have added fields to a Report, there are multiple options to configure those fields:
-
Display
The option to select true or false allows users to indicate whether a particular field should be visible or hidden in the report. This feature is useful when users want to use certain fields to perform functions such as sorting, grouping, or totaling, but do not want them to appear on the final report.
-
Link
By selecting the true or false option, users can choose to turn a field into a hyperlink. Enabling this option will add a link to the field on the Detail View of the report, which can be clicked to navigate to the corresponding record. For instance, linking the Opportunity Name field will take the user to the Detail View of that particular opportunity.
-
Label
This label will appear on the report for the corresponding Column/Field. Users have the option to modify the label from the default setting to any alphanumeric value they prefer.
-
Function
There are five functions available: Count, Minimum, Maximum, Sum, and Average. These functions can be applied to alphanumerical fields, enabling users to perform various calculations. For instance, users can calculate the average amount of an opportunity or count the total number of opportunities at a particular sales stage.
-
Sort
The Ascending or Descending option enables users to choose the sorting order for a field or column, either in ascending or descending order. This feature can be applied to all fields within the report.
-
Group
The true or false option allows users to group data based on a particular field. Enabling this option allows for data grouping by the selected field. For example, when creating a report on opportunities, users can group the data based on the Sales Stage field.
-
Total
There are three calculation options available: Count, Sum, and Average. These options enable users to perform total calculations on numerical fields, which is particularly useful for financial reporting. For example, users can calculate the total value of all opportunities at a specific sales stage using the Sum option.
Charts
Reports can be enhanced with the addition of charts, which offer a graphical representation of the data contained within the report. Visual aids, such as charts, can be especially helpful for certain users or in particular scenarios, as they can facilitate faster analysis and better comprehension.
Charts Type
There are six types of chart that the user can select to display Report data. These are:
- Pie Chart
- Bar Chart
- Line Chart
- Radar Chart
- Stacked Chart
- Grouped Chart
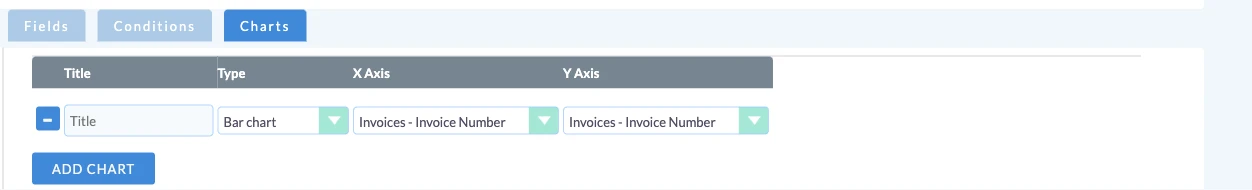
To include a chart in a report, users can navigate to the Report Edit
View and click on the 'Add Chart' button located below the Conditions
section.
After clicking on the 'Add Chart' button, users will have the option to
provide the following details:
-
Title
Users can provide a title for the chart, which will be displayed on the Detail View of the report.
-
Type
This feature enables users to choose from the six types of charts mentioned earlier.
-
X Axis
Users can select the column to be used for the horizontal axis.
-
Y Axis
Users can select the column to be used for the vertical axis.
After providing the necessary chart details, users can save the report, and the chart will be displayed on the Detail View of the report, located below the list of returned records.